Articles
Shopify Statistics 2026
Shopify statistics 2026 with our own first-page study: 251 results read, 85 page-one slots on Shopify's own domains, and the platform figures worth citing.

Short answer: We fetched 251 of the 259 page-one results across 28 Shopify searches on September 10, 2026. 57% of those results sit on brand domains, and the median page runs 2,338 words — a SERP dominated by company pages and long listicles. The platform figures those pages trade in are real: roughly 4.8–6.5 million active stores, $9.3 billion in 2025 revenue, and a cumulative $1 trillion in gross merchandise volume. But they describe Shopify the company, not your store. On this page, every statistic carries its denominator, its measurement date, and the decision it should move. Anything that can't change a plan, a price, or an app choice gets labeled as trivia and skipped.
Most pages that rank for Shopify statistics quote the same eight numbers and skip the fine print. The fine print is the whole game: a figure without a denominator can't be compared, and one without a date can't be trusted. This page is our 2026 edition, built to be cited, with the sample stated on every line.
If a number here made you nervous about starting, our guide to how to start a Shopify store covers the setup itself. A note on money before anything else: this site uses Shopify affiliate links. If you sign up through one, we earn a commission. You pay exactly what you'd pay anyway.
What ranks on Google for Shopify: our first-page study
Before quoting anyone's statistics, we checked who ranks for the phrase. On September 10, 2026 we pulled page-one results for 28 Shopify-related searches, 10 per query. 259 results came back; 251 pages could be fetched and measured.
- 251 of 259 — page-one results fetched across 28 Shopify searches on September 10, 2026; 8 blocked or unclassifiable pages are excluded from page-level rates (n = 251).
- 57% — of fetched results sit on a brand's own domain rather than an independent publisher's (n = 142 of 251, our classification).
- 85 of 251 — page-one slots held by shopify.com and help.shopify.com alone, 64 and 21 respectively.
- 2,338 words — median page length; 25% of pages run past 3,694 words and the longest reaches 14,891 (n = 251).
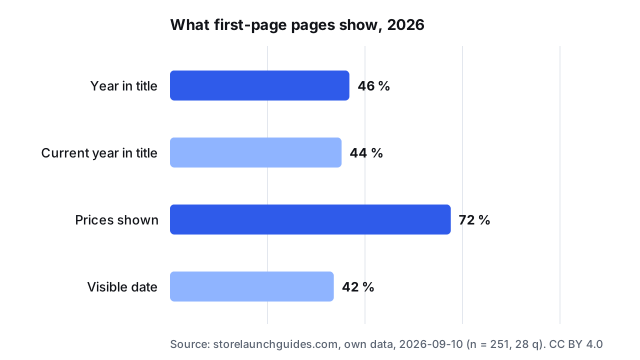
- 72% — of pages show prices, and 46% put a year in the title, 44% the current one (n = 251).
| Query | Results fetched | Median words | Year in title | Top page type |
|---|---|---|---|---|
| shopify statistics 2026 | 10 | 3,210 | 100% | study |
| shopify statistics | 10 | 2,692 | 80% | study |
| shopify trends 2026 | 10 | 3,188 | 100% | listicle |
| how many shopify stores are there | 8 | 1,409 | 75% | other |
| shopify app statistics | 10 | 2,017 | 40% | study |
| shopify pricing statistics | 10 | 4,536 | 80% | guide |
| how many shopify stores in the us | 9 | 1,796 | 30% | product |
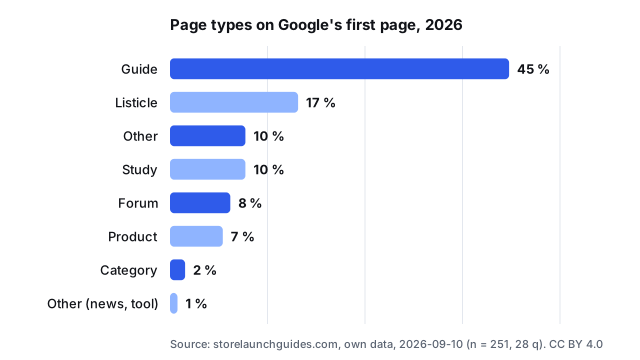
Now the elephant. shopify.com holds 64 of those 251 slots and help.shopify.com another 21, so a third of page one is Shopify writing about Shopify. Most of the rest splits between YouTube walkthroughs (15 results), Reddit threads (14), and affiliate guide sites such as ecommercetrix.com (6) and uptek.com (5). The whole set draws on just 89 distinct domains.
For a store owner, that shape matters more than any single figure. Only 26 of the 251 pages are studies with a stated method; 113 are guides and 42 are listicles. When you borrow a number from this SERP, you are usually borrowing from a page selling something. Verify the denominator first. That is the rule the rest of this page applies.
Which Shopify statistics should change what you buy
A statistic earns a place on this page only if it can move one of three decisions: what you sell, what you pay, or what you install. The plan price you should trust is the live one on Shopify's pricing page, not a figure copied from a blog. The table sorts the eight headline numbers by the decision each should move.
| Statistic | Published figure (and date) | What the denominator counts | Decision it should move | Confidence (ours) |
|---|---|---|---|---|
| Active stores | 4.8M–6.5M (2025 estimates in circulation) | Stores on a paid subscription at a point in time | Whether your niche feels crowded before you commit | Low |
| All-time stores | ~9.7M (cumulative) | Every store ever opened, including trials and closed ones | None — skip it in planning | Low |
| Revenue | $8.88B in 2024, ~26% growth; $9.3B in 2025 | Shopify's own subscription and merchant-solutions billing | Judge platform longevity, not your forecast | High |
| GMV | $1T cumulative | All merchant sales ever processed | Scale context only | High |
| Market share | ~30% US; 10–28% global (2025 estimates) | Share of ecommerce sites running Shopify | Reassure a choice already made | Medium |
| App Store size | 11,905–13,000 listings (2025 counts) | Public listings, including near-duplicates | Plan to search, not browse | Medium |
| Apps per store | ~6 average (2025 estimate) | Mean installs per merchant | Budget a lean stack and review it twice a year | Low |
| Average order value | No current official figure | Varies by methodology | Compute your own from order data | Skip |
Our suggested vetting checklist, the same five questions we ran on every figure above:
- What is the denominator: stores, orders, dollars, or visits?
- When was it measured, and what has changed since?
- Which decision does it move: plan, price, or app?
- Who profits when I repeat it?
- Can I trace it to a named source?
Our take: Two numbers on this page deserve a place in a business plan. The revenue line says Shopify Inc. will still be processing payments in five years, and the abandonment figures say where your own money leaks. The store counts are a ceiling to plan under, not a forecast; if an idea only works when the market is empty, the market was never the problem.
Shopify's revenue and GMV describe the platform, not your store
Shopify Inc. reported $8.88 billion in 2024 revenue, up about 26% from $7.06 billion in 2023 — the company's own figure, carried by most roundups. The $9.3 billion that 2026 roundups quote for 2025 is an estimate in circulation, not a figure we traced to a filing. Either way, they measure Shopify's billing, not any merchant's success. A rising line tells you the platform will keep building.
Cumulative GMV passed $1 trillion, the milestone the 2026 roundups mark and a company metric. GMV counts every dollar merchants process, including stores that close next quarter. It is not your revenue and never will be; what actually reaches your account is what our guide to how Shopify pays you explains.
Market share estimates put Shopify near 30% of US ecommerce sites and between 10% and 28% globally, depending on how a "site" is counted. That spread is a reason to stop arguing about share and check the plan math in how much does Shopify cost instead.
Store counts and countries are benchmarks you have to deflate
The circulating range for active stores is 4.8 to 6.5 million, against roughly 9.7 million opened all-time. Shopify publishes neither count. The gap between them is closed and abandoned stores, which is exactly why the all-time figure predicts nothing about your odds.
Geography deflates the rest. Shopify has long claimed merchants in more than 175 countries, and an estimated 55% to 57% of stores sit in the United States. A "typical store" statistic is therefore mostly an American story. For the US denominator, the Census Bureau's quarterly e-commerce report is the series to cite; Eurostat's e-commerce statistics do the same job for Europe.
Average order value gets quoted everywhere and verified nowhere. Shopify publishes no current official figure, and the estimates in circulation mix business models. Build yours from your own orders; it is the only AOV that should set your pricing.
How to read the Shopify App Store before you install anything
Counts of the App Store land between 11,905 and 13,000 listings, and merchants are said to install about 6 apps on average. Neither figure comes from Shopify, and the listings include near-duplicates and abandoned projects. Treat the store as a search problem, not a browse.
The numbers that should gate an install come from checkout research, not app marketing. Six figures from the reference cart-abandonment series, updated through 2025, earn a line here:
- 70.22% — the average documented cart abandonment rate, calculated from 50 studies (Baymard Institute, 2025).
- 40% of abandoners left because extra costs, shipping and fees chief among them, climbed too high (the same 50-study series, 2025).
- 42% of US online shoppers have abandoned a cart while just browsing, not ready to buy (the same series).
- 19% ditched an order because they did not trust the site with their card details (Baymard's 2025 update).
- 17% quit over a long or complicated checkout (the same analysis).
- 23.48 form elements appear in the average US checkout by default; 14.88 counting fields only (the same checkout study, 2025).
Each figure settles a purchase. The 40% says shipping-cost transparency beats any urgency app. The 42% says some abandonment is unfixable, so don't buy tools chasing it. The 23.48 says count your checkout's default fields before paying for optimization. Then price the stack; our breakdown of what Shopify apps actually cost runs the monthly math.
The Shopify statistics nobody publishes
Three numbers would matter more than anything above, and nobody publishes them. There is no median store revenue, only averages that a few large sellers drag upward. There is no annual closure rate, despite the millions of dead stores implied by the 9.7 million all-time count. And there is no split between dropshippers and inventory-holding merchants.
Treat any page claiming those figures as a guess with formatting. If the churn gap makes you doubt the platform itself, our is Shopify legit piece takes the question head-on. The numbers that would answer it for your store sit in your own admin; our tour of how to use Shopify shows where to look.
If a number can't change a plan, a price, or an app choice, it doesn't belong in your notes.
How we counted
We pulled page-one results, 10 per query, for 28 Shopify-related searches on September 10, 2026, through our hub's search layer. Each fetched page was classified by type and measured for word count, year in the title, visible prices, and a visible date. Eight results were blocked or unclassifiable and are excluded from page-level rates, which is why rates use n = 251 rather than 259. Confidence ratings on platform figures are our editorial judgment, not the publishers' claims.
Previous years
This is the first edition, published September 10, 2026; when we refresh the page next year, the 2026 figures move here.
Sources
- Baymard Institute, "50 Cart Abandonment Rate Statistics 2026". https://baymard.com/lists/cart-abandonment-rate — checked September 10, 2026.
- U.S. Census Bureau, "Quarterly Retail E-Commerce Sales Report — 2nd Quarter 2026". https://www.census.gov/retail/ecommerce.html — checked September 10, 2026.
- Eurostat, "E-commerce statistics — Statistics Explained". https://ec.europa.eu/eurostat/statistics-explained/index.php?title=E-commerce_statistics — checked September 10, 2026.
Download the data
The aggregates on this page are Store Launch Guides's own data (never per-product prices or third-party text). Each file carries the snapshot date, the sample size and the method.
Public copy of these files and charts: pablobravo44.github.io/shopify-guides-statistics-datasets/
Licence CC BY 4.0: you may reuse these figures and charts by crediting Store Launch Guides with a link to this page.